|
|
Achieving Flat Response in a Home Theater, Part 3 | |||||||||
|
|
Click here to view Part 1 of this series. Click here to view Part 2 of this series.
Frequency Response Improvement Methods
There are a number of methods that might be used to improve the frequency response of a listening room, other than changing the electronic equipment, interconnects, or loudspeakers.
|
| ||||||||
|
Room Dimensions - Altering the characteristics of the room itself will achieve major frequency response improvements. This, of course, applies only if we have input before a home theater room is built or remodeled. All three pairs of facing boundary surfaces in a rectangular room produce individual sets of modal frequencies, depending on the surface spacings (room length, width, and height). It is desirable for these modal frequencies to be evenly distributed across the bass frequency range, causing a more uniform effect on the frequency response at any particular point in the room. If the ratio between the three dimensions is not optimum, however, the three sets of modal frequencies will group together in some parts of the bass spectrum and leave modal voids at other frequencies. This tends to cause uneven frequency response at just about any point in the room.
| ||||||||||
|
| ||||||||||
|
|
Fig. 1: Optimum ratios between a listening room’s length, width, and height will cause an optimum frequency distribution of the room modes, without modal coincidence or gaps. |
| ||||||||
|
| ||||||||||
|
Note: This discussion has addressed only axial modes, in which sound reflects between two facing surfaces. There are also weaker-effect tangential modes (four surface reflection path) and oblique modes (six surface reflection path), which help to fill in modal voids, especially at higher frequencies.
| ||||||||||
|
One method to help provide smooth room frequency response is to use one of the industry-determined “golden ratios” to set the relationship between length, width, and height of the room, or better yet, use a software program specially designed to calculate optimum room dimension relationships. RPG Diffusor Systems sells a room dimension program (http://www.rpginc.com/products/roomsizer/) and Home Acoustics Alliance (HAA) provides such a program as part of its Maximizing Home Theater Performance training class. (mailto:haa@questai.com?subject=Dimensional Analysis Software).
| ||||||||||
|
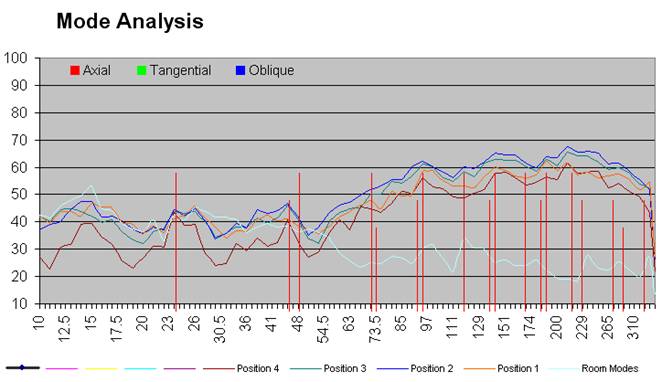
Listener Position - Once a listening room has been established, whether its dimension ratios are optimized or not, there is much that can be done to improve the frequency response. Where the listener(s) sit in the room, in relationship to the various modal peaks and nulls, will have a great effect on the perceived frequency response. At each different point in the room, a listener is in a different segment of the peak/null modal structure for each of the different frequency room modes. This is referred to as the listener's modal coupling.
| ||||||||||
|
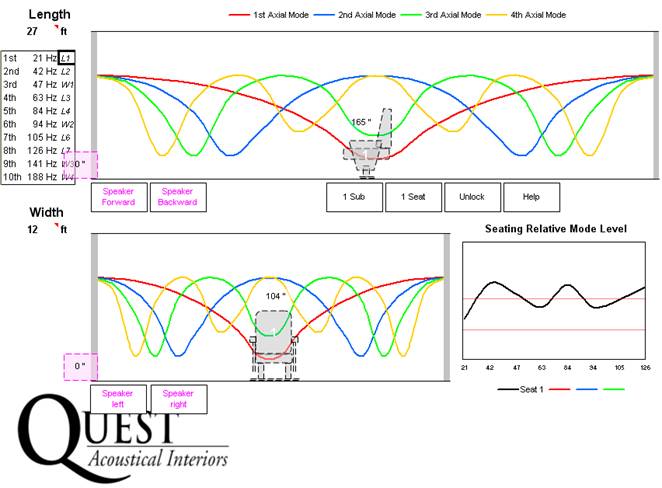
You might imagine that sitting in the exact center of the room will produce the most extreme peaks and nulls at all the modal frequencies, as all axial modes produce either a peak or a null halfway between the two reflecting surfaces. An RTA can be used to sample potential listener positions in the room for the flattest response, as broadband pink noise is being played into the room. Also, HAA provides a program to optimize listening room seating positions as part of its Maximizing Home Theater Performance training class (mailto:haa@questai.com?subject=Mode Demo Software) and RPG Diffusor Systems sells a room optimizer program that optimizes for one listening position (http://www.rpginc.com/products/roomoptimizer/). | ||||||||||
|
| ||||||||||
|
|
Fig. 2: Software programs are available to help optimize the positions of listeners and loudspeakers for flattest response. |
| ||||||||
|
Loudspeaker Position - When an RTA measurement is made at a listener position, it will probably be noted that one or more of the bass frequencies have significant peaks above the average level of the rest of the audible spectrum. If bass management is being employed in the surround processor, the bass from all channels is routed to the subwoofer, along with any LFE audio that may be present. Having all the bass being reproduced from one (or two) subwoofers gives us the opportunity to move the subwoofer(s) to different points in the room's modal structure. If the subwoofer is placed at a peak in the modal structure for a particular frequency, the subwoofer will be able to transfer much energy into the room at that frequency. However, if the subwoofer is moved to a null point for that same frequency, it will not be able to transfer very much energy into the room at that frequency. This is referred to as the loudspeaker's modal coupling.
| ||||||||||
|
If you have a 24' long room, for example, the first, second, and third length modes are 23.5 Hz (1130 fps/24 Hz/2), 47 Hz, and 70.6 Hz, respectively. If, at a selected listener position, the RTA shows a response peak at 71 Hz, that peak can be reduced by moving the subwoofer closer to a modal null position for 71 Hz. Since 71 Hz is the third length mode for the room, we know that there will be three evenly-spaced 71 Hz nulls between the end walls; at 1/4, 1/2, and 3/4 of the distance between the end walls. Move the subwoofer away from the end wall, toward the first 71 Hz null, while watching the RTA response plot. As you move the subwoofer closer to the 71 Hz null, the response will flatten out at 71 Hz. The same software programs that aid in listener positioning also help to position loudspeakers for optimal frequency response.
| ||||||||||
|
|
|
Fig. 3: Modal response peaks can be reduced by moving the loudspeaker closer to a modal null for that frequency. |
| |||||||
|
| ||||||||||
|
Bass Absorption - Another method that will assist in flattening a room's low frequency response is to somewhat selectively reduce the amount of low frequency energy in the room. Since all axial room modes produce sound level peaks at the room boundary surfaces, a corner of the room will contain peak sound pressure levels for all the modal frequencies of the adjacent surfaces. If we place a device in a corner of the room which absorbs bass frequency sound energy (a bass trap), the sound levels in the room at the modal frequencies will be reduced somewhat more than at non-modal frequencies, due to the modal frequency energy peaking at the room’s corners.
|
Fig. 4: Low frequency absorption products placed in room corners help flatten modal peaks and nulls. |
| ||||||||
|
As the bass trap is placed in the corner of the room, the RTA will show that all bass frequencies will be reduced in level (some bass traps are designed to be frequency selective), but the peaked modal frequencies will be reduced more than others, flattening out the room response. The modal nulls will also flatten out somewhat, with less modal energy present to produce the cancellation effect. One disadvantage may be that the subwoofer gain will need to be increased to bring the average bass level back to the same level as that of the higher frequency spectrum, compensating for the trapping at non-modal bass frequencies. More information on bass traps is available at the ASC (http://www.acousticsciences.com/index-original.htm) and RPG (http://www.rpginc.com/products/) web sites.
| ||||||||||
|
Electronic Equalization - Once all other strategies for equalizing a system’s frequency response have been implemented, there will still likely be response peaks at the listening position(s) that are more than 2-3 dB above the average midrange level (measured around 1 kHz). An electronic equalizer is often useful in reducing these peaks to good-sounding levels. We need to understand, though, what type of electronic equalization is appropriate in different parts of the audio spectrum.
| ||||||||||
|
Above about 6 kHz, air and surface absorption in normal listening spaces usually causes the response to roll off fairly smoothly. The only equalization you should use in this part of the spectrum may be some gain cut to reduce any peaks that might exist in the roll-off. Do not use equalization boost to reduce the roll-off slope. Our ear/brain has been conditioned to expect this type of rolled-off response in normal rooms. If we use electronic equalization gain to flatten out this high frequency response, the system will sound unnaturally bright.
| ||||||||||
|
Between about 1 kHz and 6 kHz in a small listening room, we hear primarily the direct sound from the speakers, with less contributing effect from the room’s reverberant or modal field. If the loudspeakers’ off-axis responses are significantly different than their on-axis responses, the perceived (and RTA-measured) frequency response will be different at different listening positions in the room. In this frequency range, the modal distribution is sufficiently dense and uniformly distributed as to usually cause only minor response differences. Only very wide bandwidth filtering should be applied at a few points in this higher frequency spectrum to correct any broad response deviations. Adjustable-bandwidth filters that are one octave wide, or greater, work well in this frequency range to correct the wide bumps and dips.
| ||||||||||
|
In the 80 Hz to 1 kHz range, we hear a combination of the direct speaker sound and the reverberant and modal fields. In this frequency range, the modal structure is moderately dense and uniform in a small listening room. The dips and peaks in the frequency response tend to have a narrower bandwidth than at higher frequencies, but they usually don’t cover more than one or two one-third octave bands. A graphic equalizer, with fixed-bandwidth filters on standard 1/3rd octave center frequencies, usually works very well to correct the moderate peaks and dips in this frequency range, and is very convenient to use with its slider bar controls.
| ||||||||||
|
Below 80 Hz, the perceived response is determined primarily by the room’s modal effects. This, of course, changes greatly from one listening position to another. Peaks and nulls in this frequency range are more extreme than at higher frequencies and are very narrow bandwidth. This frequency range stands to benefit the most from equalization efforts, electronic or otherwise. A graphic equalizer, with its fixed-frequency and fixed-bandwidth filters (usually 1/3rd octave), is usually not effective in this frequency range. In this range, a parametric equalizer, with adjustable-center-frequency and adjustable-bandwidth filters, can be tailored to exactly match the narrow peak or null that we wish to equalize.
| ||||||||||
|
Electronic Equalization Techniques
| ||||||||||
|
· Unless you are optimizing the response of only one position in a listening room, use a microphone multiplexer with an RTA. This will allow you to sample each of the listening positions, or a number of positions within the listening area, and view a response graph which averages out the modal peaks and nulls of each sampled position. This will allow you to apply equalization which benefits all listening positions.
| ||||||||||
|
· Check the system response first with one-third octave RTA resolution and pink noise input for best correlation to the way the human ear hears the system response.
| ||||||||||
|
· Check and equalize only one speaker at a time. Use a digital signal generator with individual channel control, a surround sound test DVD, or feed analog pink noise test signal to both left and right processor inputs with the processor set for Dolby Pro Logic (disconnect all but the desired speaker).
| ||||||||||
|
· In terms of the improvement that will be heard in sound quality, it is most important to equalize the bass frequencies (from a subwoofer, if the system uses one). Next, the LCR channels should be equalized at 80 Hz and above. Finally, the surround channels can be equalized for flattest response at the listening position(s). The surround channel response is less critical, however, than either the subwoofer or LCR channels.
| ||||||||||
|
· Check and equalize the subwoofer by feeding broadband pink noise to the center channel only. With bass management turned on (center speaker set to “small”), this routes the center channel bass to the subwoofer. This also allows you to check the subwoofer crossover, or splice, to the center channel.
| ||||||||||
|
· For each speaker, establish a reference level for evaluating response deviations across the spectrum. While playing pink noise through a speaker, check the SPL level of the five 1/3rd octave bands centered on 1 kHz. Average these five levels and use the average as the reference for checking the level of each of the 1/3rd octave bands.
| ||||||||||
|
· Since our hearing is much more sensitive to peaks in the response than it is to dips, concentrate primarily on reducing the peaks that are more than about 2 dB above the average midrange level.
| ||||||||||
|
· Since response dips are often due to modal cancellation, adding gain at a dip frequency will often have little effect on the response. To test this, add 3 dB of gain at a dip frequency. If the response level doesn’t increase by at least 2 dB, modal cancellation is occurring at that frequency. Any gain you add at that frequency will result primarily in amplifier and speaker overload, dynamic range limiting, and distortion. Use any equalizer boost sparingly when trying to equalize dips or nulls in the response.
| ||||||||||
|
· Once you determine, by viewing the 1/3rd octave RTA response, that you wish to tune a parametric equalizer to a bass frequency, switch the RTA to 1/12th octave band resolution. This will allow you to see which frequencies within the 1/3rd octave are causing the problem and will allow you to accurately tune the parametric equalizer to the desired frequency.
| ||||||||||
|
Summary
We have seen that uneven frequency response in a listening room is much more a problem at bass frequencies as compared to midrange and treble frequencies. This is due primarily to the effects of room resonance modes that cause peaks and dips in the system response, and is more pronounced at some positions in the room than at others.
We have discussed that an RTA with 1/3rd octave resolution is the primary tool that we will use to measure the frequency response at different locations, in a way that corresponds to the human ear perception. For those cases in which we are measuring multiple listening positions, trying to flatten the response at all positions, a microphone multiplexer is a valuable aid in producing a spatially averaged response over the entire listening area.
There are a number of methods you can employ to flatten the frequency response at one or more listening positions. You can build the listening room to favorable dimensions that result in a more even distribution of room modes. You can position the listener(s) and loudspeakers, especially a subwoofer, to locations that result in flatter response. You can use bass absorption devices to somewhat flatten modal nulls and peaks. In addition, you can use an electronic equalizer to perform the final flattening of peaks in the listening position frequency response, especially at low frequencies. To guide the adjustment of an electronic equalizer or listener and subwoofer positions, we will use an RTA set to 1/12th octave resolution. This will help us see narrow bandwidth peaks and nulls in sufficient detail to exactly perform corrective adjustments.
In this series of articles we have examined the different effects that cause us to have less than the desired audio frequency response from our audio system. We have also seen that, with the proper test equipment and adjustment techniques, we can greatly improve the frequency response of our listening room. | ||||||||||