How to find modes with ETF
What most people do with ETF is they do a single test with the microphone in one single spot and their speakers (all of them) driven simultaniously from other spots,
and they get a graph like this:

And I see peaks and dips all over that.
But are those peaks and dips (hills and valleys) caused by:
| bad speaker response | |
| speaker/speaker comb filtering |  |
| SBIR and other reflections |  |
| room modes excited by speaker position |  |
So, to tell they might move the microphone around a bit.

But once again I can't identify a mode from that chart which was made by 'random' microhpone positions.
So let's go back and think about modes for a moment.
Modes are Standing Waves, and may be created from two waves (with equal frequency, amplitude and wavelength) travelling in opposite directions. Using superposition, the resultant wave is the sum of the two waves. The animation below shows that the net result alternates between zero and some maximum amplitude. Unlike the travelling waves, the standing waves do not cause a net transport of energy (because the two waves which make them up are carrying equal energy in opposite directions).

Let's say, hypothetically, that we had a room that was 15'2" x 11'4" x 7'6".
Volume: 1289 ft^3
Surface Area Total: 736 ft^2
Surface Area Floor: 171 ft^2
Below, the modes are identified by their mode number (room length component, room width component, room height component)
If they have only one component then they are Axial (reflecting off two walls)
If they have two components then they are Tangential (reflecting off four walls)
If they have three components then they are Oblique (reflecting off six walls)
Freq		Wavelength, 1/2, 1/4	Mode
37.2 hz  	30'5", 15'2", 7'7" 	(1,0,0 Axial)
49.9 hz  	22'8", 11'4", 5'8" 	(0,1,0 Axial)
62.2 hz  	18'2", 9'1", 4'7" 	(1,1,0 Tangential)
74.5 hz  	15'2", 7'7", 3'10" 	(2,0,0 Axial)
75.3 hz  	15'0", 7'6", 3'9" 	(0,0,1 Axial)
84.0 hz  	13'5", 6'9", 3'4" 	(1,0,1 Tangential)
89.6 hz  	12'7", 6'4", 3'2" 	(2,1,0 Tangential)
90.3 hz  	12'6", 6'3", 3'2" 	(0,1,1 Tangential)
97.7 hz  	11'7", 5'9", 2'11" 	(1,1,1 Oblique)
99.7 hz  	11'4", 5'8", 2'10" 	(0,2,0 Axial)
105.9 hz  	10'8", 5'4", 2'8" 	(2,0,1 Tangential)
106.5 hz  	10'7", 5'4", 2'8" 	(1,2,0 Tangential)
111.7 hz  	10'1", 5'1", 2'6" 	(3,0,0 Axial)
117.1 hz  	9'8", 4'10", 2'5" 	(2,1,1 Oblique)
122.4 hz  	9'3", 4'7", 2'4" 	(3,1,0 Tangential)
124.5 hz  	9'1", 4'6", 2'3" 	(2,2,0 Tangential)
125.0 hz  	9'0", 4'6", 2'3" 	(0,2,1 Tangential)
130.4 hz  	8'8", 4'4", 2'2" 	(1,2,1 Oblique)
134.8 hz  	8'5", 4'2", 2'1" 	(3,0,1 Tangential)
143.7 hz  	7'10", 3'11", 1'12" 	(3,1,1 Oblique)
145.5 hz  	7'9", 3'11", 1'11" 	(2,2,1 Oblique)
149.0 hz  	7'7", 3'10", 1'11" 	(4,0,0 Axial)
149.6 hz  	7'7", 3'9", 1'11" 	(0,3,0 Axial)
149.8 hz  	7'7", 3'9", 1'11" 	(3,2,0 Tangential)
150.7 hz  	7'6", 3'9", 1'10" 	(0,0,2 Axial)
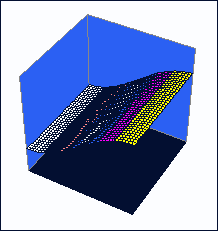
Figure 1) The 0,1,0 Mode |
Figure 1) shows the first order resonant mode between the two walls. This is the lowest frequency that will resonate between these two walls and it occurs at the frequency where 1/2 wavelength fits exactly between the two walls.
This is the (0,1,0 Axial) mode @ 49.9 hz
wavelength 22'8" (double room width) |
|

Figure 2) The 0,2,0 Mode |
As you look higher in the frequency spectrum, every time an additional 1/2 wavelength fits exactly in between the walls, a new resonant condition occurs. Figure 2) shows the next highest mode, which is one half wavelength more than the first or one full wavelength. You can see that when the wave is maximum at the walls, it is at a minimum in the middle and vice versa.
This is the (0,2,0 Axial) mode @ 99.7 hz
wavelength 11'4" (exactly room width) |
|
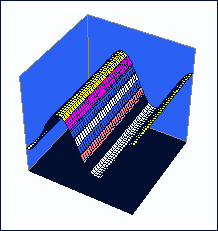
Figure 3) The 0,3,0 Mode |
Figure 3) shows a the resonance when 1.5 wavelengths is between walls.
This is the (0,3,0 Axial) mode @ 149.6 hz
wavelength 7'7" |
|

Figure 4) The 0,4,0 Mode |
Figure 4) shows two full wavelengths between the walls. These discrete conditions of resonance are called resonant modes. Resonant modes are designated by integer numbers. To find the mode number, simply count the number of minima (points where the level doesn't change during resonant excitation) between walls. You'll notice in figure 1) there is one point where the level remains constant. In figure 2), there are two minima. In figure 3), three minima. And so on. These are the first, second and third order axial modes respectively.
This is the (0,4,0 Axial) mode @ 199.5 hz
wavelength 5'8" |
|
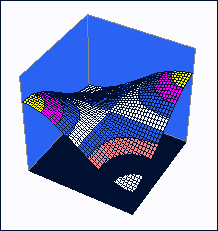
Figure 5) The 1,1,0 Mode |
A normal room has three sets of parallel walls: front to back, side to side, and floor to ceiling. Resonances along a single axis of the room---between a pair of parallel walls---are called "axial" resonances. Simple axial modes between walls are the most severe contributors to resonance effects. But, there are modes supported by the volume of the room which are determined by multiple wall pairs. For example, there is a mode which goes corner to corner and is shown in Figure 5). You'll notice that one pair of diagonally opposed wall corners is high, while the other two are low. This is designated as the 1,1,0 mode. Modes supported by two wall pairs are called "tangential" modes
This is the (1,1,0 Tangental) mode @ 62.2 hz
wavelength 18'2" |
|

Figure 6) The 3,2,0 Mode |
This is the (3,2,0 Tangental) mode @ 149.8 hz
wavelength 7'7" |
|

Figure 7) The 2,2,0 Mode |
This is the same sort of thing, but a different way of looking at it. Porous absorbers absorb best at velocity/displacement spots. Membrane traps absorb best at spots where the pressure changes. Your ears and SPL meters work on pressure, so where the presure doesn't change it's a quiet spot. Where there's a presure peak it's louder than the direct sound. Where there's a pressure null it's quieter than the direct sound. Where it's quieter, you don't hear that frequency. Where it's louder you hear that frequency. In Home Theatre, the peaks become notes that the room sings at, so you don't hear LFE so much as a note when the ships cannon go off.
This is the (2,2,0 Tangental) mode @ 124.5 hz
wavelength 9'1" |
|

Figure 8) The Harman Axial Mode Calculator |
Figure 8 shows the axial modes for the various frequencies, and relates them to the room position. Anyplace where the curve is high is loud at that frequency, and anyplace where the curve is low that frequency is quiet. Similarly, if you place your subwoofer at any place where the curve is high it will energize that mode, and if you place your subwoofer at a place where the curve is low you will not energize that mode.
Below the red dot is the speaker position, and the graph shows how much (or if) the mode is being energized at that position.
  |
|
Ok, so let's do some measurements. Let's say we use ETF5 at around 60dB(c). At modal peak (locations in the room) it will be louder than that at the frequency of that mode, and at modal nulls (location in the room) it will be quieter than that at the frequency of the mode.

Let's pretend for a moment that this room magically only has the one mode, and there are somehow no reflections.
What we'd see is a frequency response like this:

You can see that modes actually have BANDWIDTH, and not just a single frequency -- they affect, to lesser degrees, frequencies on either side of the center frequency of the mode.
OK, so what's a mode? (i.e. what are we looking for)
A mode is something that has:
- a center frequency
- room position dependant (and repeatable)
- a bandwidth
- has a peak and a null
- both louder and quieter than the frequencies on either side of it, depending on where in the room you are.
Let's look at a real room response: Paul Woodlock's

So, where should we put our microphone.

You can see how I've shown 5 microphone positions, and I want them evenly spaced based on the quarter wavelength.
I'm using a quarter wavelength because I want to gurantee that somewhere in there I hit BOTH a PEAK and a NULL.
Above, because we started at a peak and ended at a null, we got away with 1/4 wavelength. But what if we started just to the left of a peak, and ended up just to the right of a peak? Well, that would be bad because we never hit a null. So let's traverse 1/2 wavelength instead, using 9 positions.
So, we're not using a spacing of something fixed like 5", it's wavelength dependant.
In this case the room is 11'4" wide. A quarter wavelength is 34". Divide that by 5 and we get 6.8" between microphone positions when moving left and right.
The above is obvious for the width of the room.
Length is similar, except the listening position is not 'centered' in the room length.
But it doesn't matter that the first microphone position is in a peak, and the last microphone position is in a null. All that matters is that one of the microphone positions is in a peak and another is in a null. And if we traverse a linear distance of 1/4 wavelength, we're guaranteed to hit both. And when we plot them all on top of each other, we won't care which one was first and last -- but we'll still see the mode. One of them will be a peak, one of them will be a null, and the rest will be dB levels (curves) in between. We have no idea which one will be a peak and which microphone position will be a null, but we don't care because we're plotting them all on one graph.
The room is 15'2" long. A quarter wavelength of that is 45". Divide that by 5 and we get 9.1" between microphone positions.
So here we have the microphone positions for width and length:

Notice how in both cases, the separation is actually 1/2 the room. It's 1/2 the room wide that we're taking 9 samples of. And 1/2" the room long we're taking 9 samples of.
Now look at the modal lines from the harmon graphs on the side and the bottom -- and you can see that the there are peaks and nulls in each of the second, third, and forth modes in each axial direction within the microphone testing region. So we should detect those modes too, in the same set of measurements, assuming they are energized.
Of course we have to do height as well.
In this case the room is 7'6" high. A quarter wavelength is 22". Divide that by 5 and we get 4.5" between microphone positions when moving up and down.
The center point measurement (listener position) you only have to do once. So that leaves 8 measurements for each axis (height/width/length = 3 of them. 3*8 = 24), or 1 + 24 = 25 measurments.
Each axis (9 measurements) should be plotted on top of each other, giving three graphs (a length modal frequency response, a width modal frequency response, and a height modal frequency response). RplusD makes this trivial (better than ETF5 at this).
At which point you'll see which modes are active, and their relative strengths.
And these are the room's real modal frequencies, not just some calculations that may be off depending on how soft your walls are, or how much your room absorption has moved the modal frequencies around. (a failing of my modal calculator, and everyone elses too)
Any frequency that appears in more than one graph is probably tangental or oblique, and any frequency that is a mode in just one graph is axial.
In any event, seeing it's a mode in one axis, will tell you which walls/ceiling to put absorption onto. If it (any component) shows up on the length graph, then the front wall and rear wall are places for an absorber. If it shows up (any component) on the height graph, then floor or ceiling are places for an absorber. Treat the worst mode first.
The frequency of the mode will tell you how to make the absorber.
One technique is to use porous insulation 1/4 wavelength deep. Obviously for a first axial mode 1/4 wavelength is half the room which is silly. Fortunately higher order modes are smaller, and partial absorption might be enough.
I ignore the (1,0,0), (0,1,0), and (0,0,1) modes -- assuming the frequencies are too low to treat with porous absorption.